Introduction #
You can imagine a WHM based server as a completely self-sustained eco-system. There are a lot of running services and each one of them has its own task and if one of them starts malfunctioning, every other could potentially start facing problems as well. It is really important that you track each service and make sure it is fully operational all the time. As WHM is the industry-leading hosting platform, there are a lot of third-party services that are fully interactable with it and when installed, you can enable them to show up on the status page as well so you may easily monitor their status from the WHM control panel. This guide will explain everything there is to the Service Status page. Let’s start!
Accessing the Service Status feature in WHM #
First, you need to log into the WHM service for your VPS or Dedicated Server. After you have logged in, please use the search bar on the left side of the page and type “Service Status”.

When the functionality shows up below the search bar, please click on it so you can be sent to the “Service Status” page.
Reading from the Service Information #
The first thing you are going to see under the “Service Information” label on the top will be a blue text bar letting you know that in order for a service to appear in the bottom table section so you can monitor its status, you need to first enable it for service monitoring from the “Service Manager” feature. We have a separate tutorial on the matter so please, feel free to check it out How to use the Service Manager feature. To easily be redirected to that page, please click on the “Service Manager” link located inside the blue text bar.
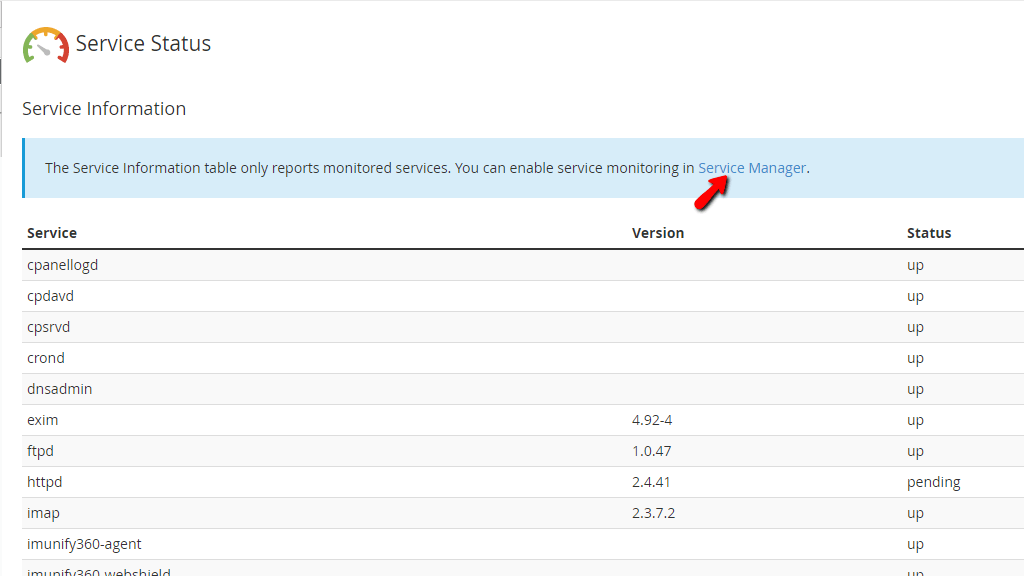
When you scroll down below, you will find the “Service Information” table section which contains the following columns.
- Service – This will display the name of the working service.
- Version – This will show the version of the working service.
- Status – Lastly, this will display its status. You want this to be saying “up” all the time!
Scrolling even further down, you will get to the second section which is the “System Information”. It will contain another table section with rows displaying the following.
- Server Load – This shows the current server load.
- Memory Used – This will display the current memory utilization.
- Swap Used – This will show the amount of swap memory used. You want this to be at 0% all the time.
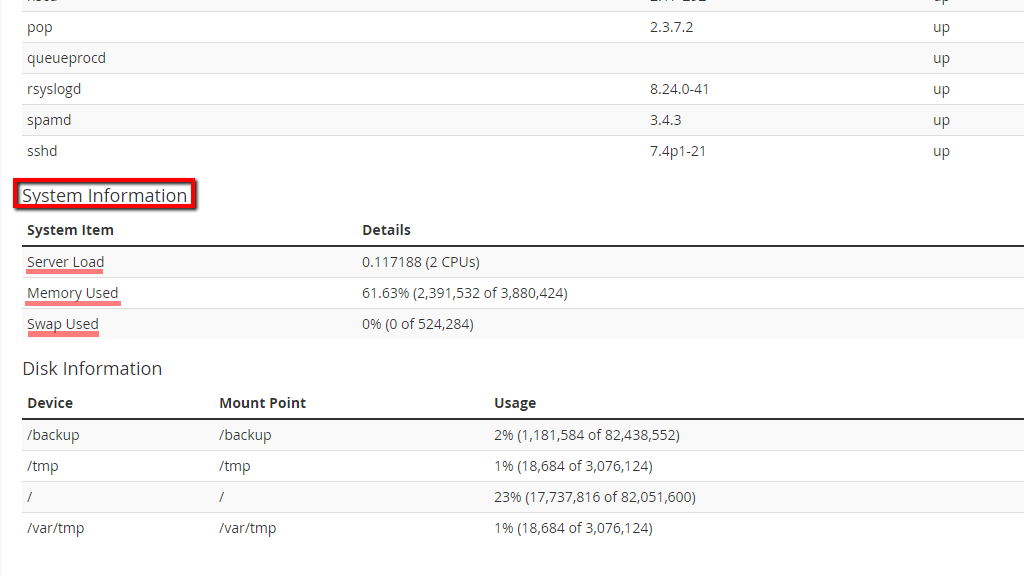
Lastly, you will see the “Disk Information” section at the bottom of the page.

In this section, you will be able to see all of your mounted disks along with their mount points and usage.
This sums up our tutorial about the “Service Status” feature in the WHM control panel. It does not contain a lot of information but for what it lacks in thoroughness, it compensates with importance. If you have any questions regarding this specific functionality, please feel free to reach our Technical Support Staff 24/7 over our ticketing system in our Client Area.


